A Colorado State fellow employs machine learning for climate modeling, putting provenance behind predictions.
Pacific Northwest National Laboratory
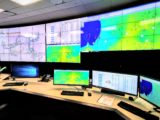
The human factor
A PNNL team works to improve AI and machine learning tools so that grid operators can feel confident using them.

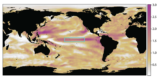
Earth’s multimodel future
A PNNL-led team’s mission: integrate climate models to reflect human impact on natural resources – and vice versa.
Revving up chemistry
Exascale computing, combined with redesigned computational chemistry software, could help researchers develop new renewable energy materials and greener chemical processes.
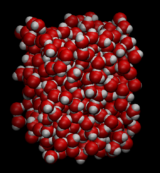
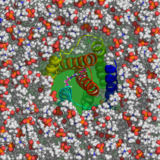
Water works
Complex simulations are unraveling the idiosyncrasies of this unique liquid’s behavior.

Powering down
PNNL team views ‘undervolting’ — turning down the power supplied to processors — as a way to make exascale computing feasible.
Life underground
A PNNL team builds models of deep-earth water flows that affect the tiny organisms that can make big contributions to climate-changing gases.
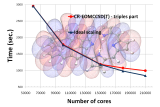
Balancing act
A Pacific Northwest National Laboratory researcher is developing approaches to spread the work evenly over scads of processors in a high-performance computer and to keep calculations clicking even as part of the machine has a hiccup.

Twice-stuffed permafrost
A Pacific Northwest National Laboratory computation suggests that the water-gas compounds found in ocean permafrost can provide energy and store it, too – and then trap carbon dioxide.
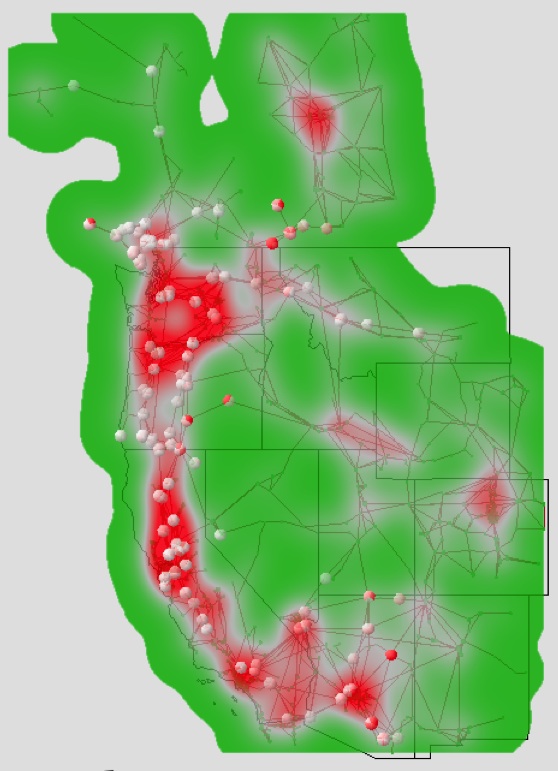
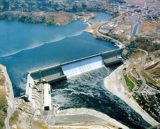
Getting a grip on the grid
A PNNL team enlists new algorithms and powerful computers to quickly analyze which combinations of failures most threaten the power grid.
The big face off
Pacific Northwest National Laboratory researchers say their algorithms can analyze millions of video frames, pluck out the faces and quantify them to create searchable databases for facial identification.